
Stock charts are graphs that show how a company’s publicly traded shares are performing. Understanding how to read stock charts is a vital skill for both professional and amateur investors. Using a stock market graph, you can learn about a company’s historical financial performance and watch how a company’s stock price fluctuates throughout the day when the market is open.
What Are Stock Charts Used For?
Stock charts are used by investing professionals, like investment bankers, investors, financial analysts, securities traders, and brokers. The information you can glean from a stock chart helps inform investing decisions and track business performance.
But stock charts are also used by average people outside of careers in finance. Some may read stock charts because they have investments in the stock market. Others watch stock market graphs because the performance of the market can impact the overall economy.
>>MORE: Learn the difference between a broker and a trader.
On stock market charts or graphs, green lines going upwards are generally good, while red lines trending down are typically bad. However, stock charts provide much more information than that. By reading a stock chart, you can understand a company’s performance over a number of years, see how much the stock is trading at, look at recent changes in its stock price, and infer details about the company’s overall value.
Stocks are traded on specific markets. For publicly traded companies in the United States, shares are typically bought and sold on either the National Association of Securities Dealers Automated Quotations Stock Market (NASDAQ) or the New York Stock Exchange (NYSE).

Citi Markets Sales and Trading
Analyze the market and pitch trade opportunities to clients in this free job simulation from Citi.
Avg. Time: 6 to 7 hours
Skills you’ll build: Written communication, market research, summarization, research, critical thinking
How To Read Stock Charts
Stock charts can be overwhelming at first glance since they show a massive amount of information in a relatively small space. However, once you understand the basic components of a stock market graph, they become fairly straightforward. Let’s look at an example of a stock chart and go through the different components and details and what they mean.
What Do Stock Charts Look Like
Company stocks are traded under a stock symbol or ticker — a short-hand representation of the company, typically five letters long or less. For example, stock symbols for some of the biggest tech companies include:
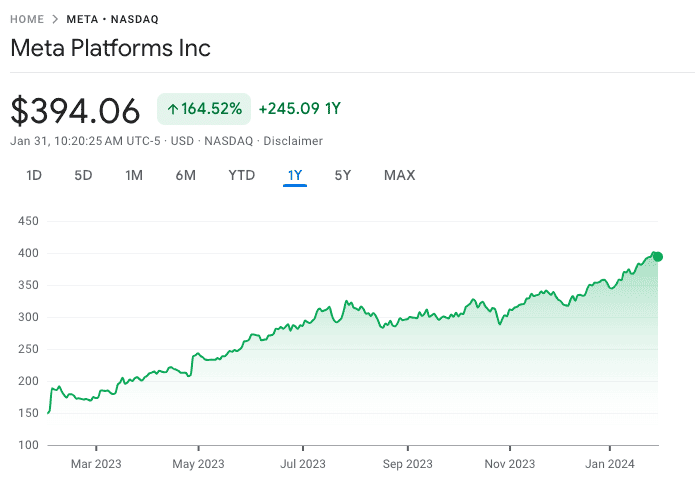
This chart is Meta’s stock over the past year, courtesy of Google Finance, a website hosted by Google that provides real-time financial data.
Components of Stock Charts
Below the chart, you can see a lot of information about the stock itself, including:
- Open: What price the stock was at when the market first opened for the day
- High: The highest price the stock has been at, for that day
- Low: The lowest price the stock has been at, for that day
- Mkt cap (market capitalization): The total value of all the company’s common stocks owned by shareholders
- P/E ratio (price/earnings ratio): A ratio of the company’s share price to the company’s earnings per share
- 52-week high: The highest price the stock has traded at in the previous 52 weeks
- 52-week low: The lowest price the stock has traded at in the previous 52 weeks
- Div yield (dividend yield): A percentage showing how much of the company’s share price it pays out each year in dividends to shareholders. (Not every company has a dividend yield. Companies in early growth stages before becoming profitable typically don’t have profits to share with investors yet.)
Using these components, you can begin to understand how the company has performed in the past. This information is pivotal to make predictions about how a company will perform in the future. Companies with steady, gradual growth are typically likely to continue that growth, barring any big economic changes (like a recession).
>>MORE: Explore other ways to analyze businesses using the top investment banking skills.
Stock charts ultimately give you an idea of whether a company is worth investing in. For example, a sudden slump in stock prices after a long growth period may be an opportunity to invest when the price is low. Or, a young company that is performing well but still has cheap share prices can be a good chance to get in early before the company really takes off. (Note: This example is for educational purposes; consult a financial adviser for specific stock-picking advice.)
Expand your financial knowledge with Forage’s finance virtual experience programs.
Showcase new skills
Build the confidence and practical skills that employers are looking for with Forage’s free banking and finance job simulations.
Showing You Can Read Stock Charts on Your Resume
If you have work or internship experience that involves investing or investment management, most employers and hiring managers will understand that you know how to read stock charts.
Additionally, reading stock charts is a common aspect of specific investing skills like business valuation or portfolio analysis and management. Other hard skills you can include on your resume that demonstrate an understanding of stock market graphs include:
- Experience in performing a discounted cash flow (DCF) analysis
- Familiarity with the comparable company analysis process
- Knowledge of how companies go public through initial public offering (IPO) or special purpose acquisition company (SPAC)
However, if you don’t have investing experience, your cover letter is a great place to include your personal trading experiences. For instance, you could talk about how you closely followed the GameStop short squeeze in 2021 and managed your own investment portfolio as part of it.
Start building the skills you need to succeed and stand out to employers with Forage’s Investment Banking Career Path.
Image credit: myronstandret / Depositphotos.com